

SwiftAction Academy | July 2026
|⚓ About Us | 📋 Training Catalog | 🎯 CIC 2026 Bundle | 🏅 Free Course Access (No Credit Card)
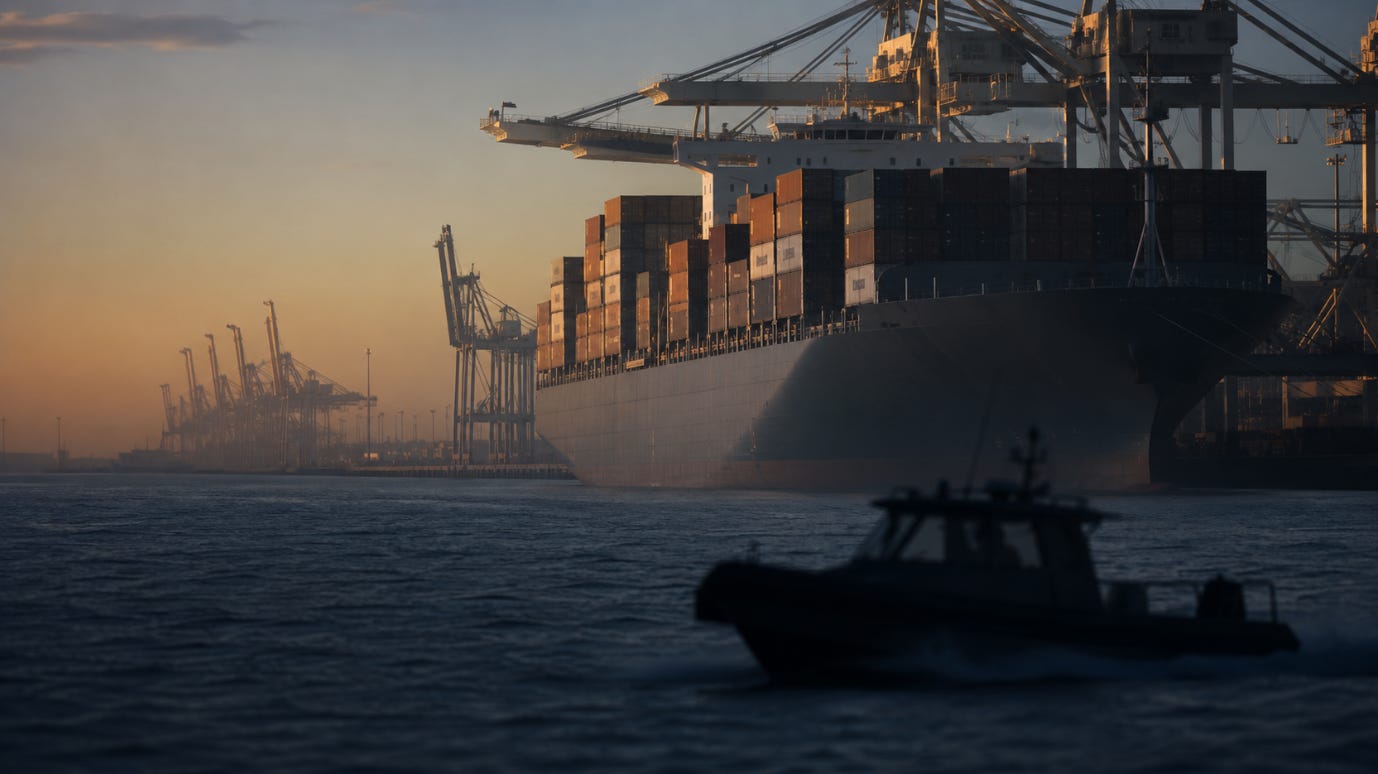
This publication’s previous issue covered the Paris MOU’s 2025 Annual Report: a European detention rate at its second-highest level in a decade, and a regime that says it cannot find a single regulatory cause. The United States Coast Guard’s own 2025 Port State Control Annual Report, published 8 June 2026, reads like the mirror image. Exams up. Detentions down. A national detention ratio of 0.85 percent, against Europe’s 4.18.
Same ships. Same conventions. Same classification societies. In many cases, the same managers. The gap is nearly five to one. The two regimes screen and target ships differently, so the ratios are not a like-for-like scorecard. The deficiency tables, though, are directly comparable, and that is where the story is.
The temptation is to read the American report as a victory lap, and its foreword comes close to one. But the deficiency chapters tell a more careful story. Fire safety led all operational deficiency categories for the fifth consecutive year. A Port State Control Officer found a ship whose cargo hold fire detection system was completely disconnected. Rescue boats could not be started or deployed. A master and chief officer could not demonstrate familiarity with security exercises or the record keeping for drills. Ships arrived not manned in accordance with their Minimum Safe Manning Document.
The American number is better. The failures behind it are the same ones filling Europe’s tables. That is the part worth reading twice.
📋 In this issue: 🧾 The Report 📊 By The Numbers 🔍 The Pattern 🎓 What Should Be Happening 👀 What to Watch 🚨 SwiftAction Signal
🔔 Not yet subscribed? SwiftAction Intelligence Covers Maritime Accidents, Detentions, and the Training Failures Behind Them. Subscribe For Free!
🧾 The Report
In 2025, a total of 11,279 individual vessels from 79 flag administrations made 76,351 port calls to the United States. That is roughly 7,700 fewer port calls than the 84,034 recorded in 2024, from an almost identical population of ships, a decline the report presents without comment. Against that traffic, the Coast Guard conducted 8,999 Port State Control exams, up from 8,710 the year before, and detained 77 ships for environmental protection, safety, and security related deficiencies.
Both headline measures improved. The annual detention ratio fell from 0.94 percent to 0.85 percent, and the three-year rolling ratio eased from 1.01 percent to 1.00 percent. Seventy-seven is the lowest detention total since 2021, and the ratio has now dropped for two consecutive years since the 2023 spike, when 101 ships were detained at 1.22 percent. A decade ago, in 2015, the ratio stood at 2.17 percent.
The report attributes the trend to the industry’s renewed focus on safety and quality and, in its words, the effective implementation of comprehensive Safety Management Systems, crediting flag states, classification societies, and vessel operators for proactively identifying and mitigating risks.
The recognition programs moved in a less comfortable direction. QUALSHIP 21, the program that rewards quality operators with fewer exams, ended 2025 with 4,659 vessels enrolled, the first decline in the five-year enrollment series shown in the report, down roughly eight percent year over year. Four flag administrations lost eligibility during the year while four gained it. The E-Zero environmental designation went the other way, closing 2025 at 605 ships, nearly 200 more than in 2024.
The Targeted Flag List, the mechanism that decides which flags face extra boarding attention, saw five administrations removed: the Bahamas, Comoros, Curacao, Italy, and Latvia. Six flags remain in the high-risk category, with three-year detention ratios that make the national average look like a different industry: Tanzania at 31.25 percent, Belize at 20.00 percent, Togo at 17.07 percent, Bolivia at 16.00 percent, Vanuatu at 4.88 percent, and Cyprus at 2.10 percent.
And the appeals data suggests the detentions that were issued are holding. Of seventeen appeals received in 2025, nine challenged the merits of a detention. Two were granted.
📊 By The Numbers
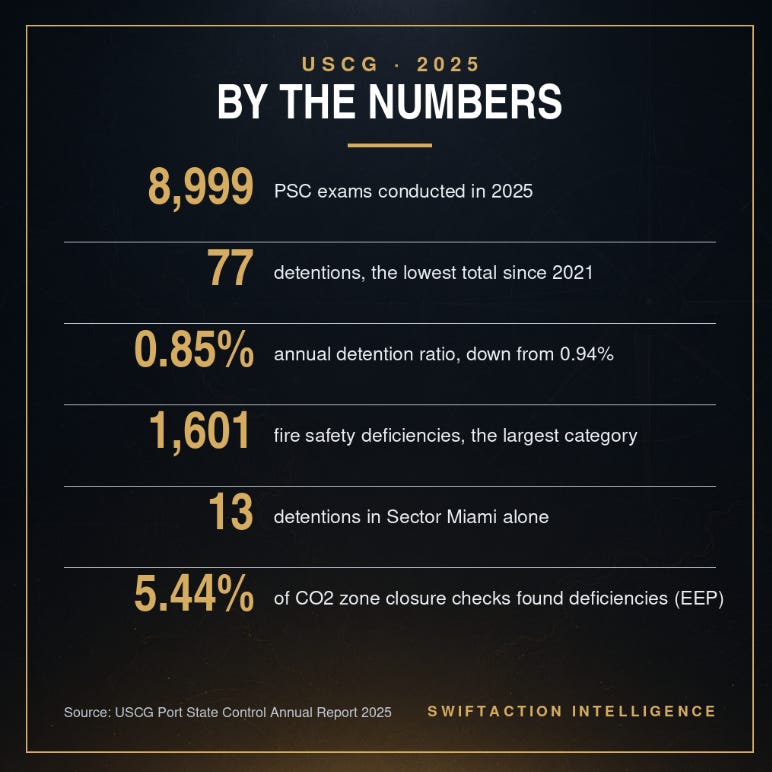
The 2025 American inspection year, in the figures that matter:
8,999 PSC exams · 77 detentions · 0.85% annual detention ratio · 1.00% three-year rolling ratio
76,351 port calls by 11,279 individual vessels · roughly 7,700 fewer calls than 2024
Fire safety: 1,601 deficiencies recorded, the largest category on the exam data table · 53 detainable, leading all operational deficiency categories for the fifth straight year
Behind the fire safety total: oil accumulation in the engine room led the detainable category with 15 findings, down only slightly from 18 the year before. PSCOs recorded oil-soaked lagging, active fuel leaks, excessive oil in bilges, and combustible materials stored throughout engine rooms. Seven detainable deficiencies involved fire detection and alarm systems, most for smoke detectors that did not function or test equipment that was not operable, and one ship was detained with its cargo hold fire detection system completely disconnected. Fire doors rounded out the category’s top three: holes in doors, warped doors, and wasted gaskets.
Detainable Safety Management System deficiencies declined again, a drop the report’s narrative puts at 65 down to 51, led by maintenance of the ship and equipment, then shipboard operations, then company responsibility and authority. Lifesaving appliance detainables fell from 20 to 13, led by rescue boats that could not be started or deployed and lifeboats with expired provisions, poor condition, or engines that failed to start. Ship certificate detainables numbered 14, several involving vessels not manned in accordance with their Minimum Safe Manning Document or crew members who did not meet certain STCW requirements. Working and living conditions produced 13 detainables, the first year the category generated enough findings to be recognized in the report’s overview, roughly half involving electrical installations and the stowage of cargo.
By ship type, bulk carriers logged the most detentions at 19, though at 0.83 percent their ratio sits at the national average across 2,290 exams. General dry cargo ships were the worst-performing major segment at 1.62 percent, nearly double the national ratio. Container ships followed at 1.01 percent with 16 detentions. At the clean end: oil tankers recorded one detention from 925 exams, a 0.11 percent ratio, and LNG carriers recorded none. Passenger ships were not detained at all, yet deficiencies were found on 52.70 percent of their exams, by far the highest share of any ship type, a reminder that findings and detainable conditions are different measurements.
By port, Sector Miami stands alone: 13 detentions from 438 exams, just under 3 percent, roughly three and a half times the national ratio and the highest count of any zone. Sector Mobile followed with 9. Sector Houston/Galveston, the busiest exam operation in the country at 1,166 exams, recorded 6.
By flag, Liberia recorded 20 detentions from 1,553 exams and Panama 10 from 1,297. Together the two registries account for 30 of the year’s 77 detentions.
The Enhanced Exam Program, the Coast Guard’s quarterly answer to a Concentrated Inspection Campaign, produced the report’s most lopsided table. Engine room automation checks found deficiencies on 0.30 percent of exams. Security under ISPS: 0.79 percent. Emergency power and electrical systems: 0.66 percent. Closures forming CO2 protective zones: 5.44 percent, with 155 deficiencies across 1,945 exams, roughly eighteen times the deficiency rate of the automation campaign. The boundaries that make a fixed CO2 system survivable are, by the Coast Guard’s own sampling, the weakest item it went looking for.
In the ballast water program, inoperable treatment systems remained the most frequent deficiency at 77 instances even after a 22.2 percent improvement, concentrated in general bulk carriers, container ships, and chemical tankers. Structural ballast tank and piping deficiencies more than doubled, from 8 to 19. Enforcement stayed measured: five Letters of Warning over the preceding 24 months.
🔍 The Pattern
Set the American report beside the two that preceded it this season and one category appears at the top of every table. Fire safety led the Paris MOU’s deficiency list at 16.8 percent of all findings. It led the Tokyo MOU’s at 18,020 findings. And in the United States it led the exam data table at 1,601 findings while topping the detainable operational categories for a fifth consecutive year. Three regimes, three targeting systems, three oceans. One leading deficiency.
The subcategories repeat across basins too. Fire doors with holes, warped panels, and wasted gaskets appear in the American detainable narrative; fire doors and openings in fire-resisting divisions have sat in the Paris MOU’s top five for three straight years. Oil accumulation in the engine room led the American fire safety detainables; cleanliness of the engine room has not left Europe’s top five. The inspection sheets on both sides of the Atlantic are, functionally, the same sheet.
What separates the outcomes is what happens before the boarding. The Coast Guard’s own assessment credits its falling ratio to the effective implementation of Safety Management Systems, and its detainable SMS count declined again this year. But the exams that still end in detention show what an SMS looks like when it exists on paper only. A master and chief officer who could not demonstrate familiarity with security exercises and drill record keeping. Companies that did not take timely corrective action on known deficiencies. A ship carrying unauthorized flammable cargoes whose SMS, on review, contained no requirement for the master or crew to verify dangerous goods compliance before loading. Rescue boats that would not start with a PSCO standing on deck. Based on available reporting, none of these are equipment shortages. Each is a gap between what the manual documents and what the crew on watch can demonstrate.
That is the quiet symmetry between a 0.85 percent regime and a 4.18 percent one. The American numbers are better because more crews close that gap before arrival. The 77 that were detained are the ones that did not. The findings were rectified on paper. The competency gap persisted at sea.
🎓 What Should Be Happening
The Coast Guard publishes its exam priorities the way the European regimes publish theirs. The Enhanced Exam Program topics are announced, the detainable category rankings barely move year to year, and the report’s own narrative names the exact failures its officers keep finding: the disconnected detector, the drill records nobody can produce, the rescue boat that will not start. An operator trading to the United States is not preparing for a mystery. The syllabus is printed annually.
Closing a finding is not the same as closing the gap. A rectified deficiency proves the item was fixed once. It does not prove that the crew sailing into Miami or Houston next month can operate the system, maintain it, and demonstrate it while a PSCO watches. That demonstration is a competency, and competency is built before the boarding, not during it.
This is where documented training earns its place in the exam file. SwiftAction Academy maps its modules one-to-one to the PSC deficiency codes that USCG, Paris MOU, and Tokyo MOU inspectors cite, and each completed module produces a record documenting completion and a passed assessment against that specific code. When the exam sheet and the training file speak the same code language, the conversation on deck changes.
🎓 The Study Guide
Seven courses mapped to the deficiencies that led the American 2025 tables:
🔥 Course 07106 – Fire Detection & Alarm System Training Seven detainable fire detection deficiencies in 2025, including one ship detained with its cargo hold detection completely disconnected. This module is free, no credit card required.
🚪 Course 07105 – Fire Doors/Openings in Fire-Resisting Divisions Holes, warped doors, and wasted gaskets placed fire doors in the American detainable top three. The same finding has spent three years in Europe’s top five.
🧯 Course 07103 – Fire Division: Decks, Bulkheads & Penetrations Closures forming CO2 protective zones produced deficiencies on 5.44 percent of Enhanced Exam Program checks, the worst result of any EEP topic by roughly a factor of eighteen.
⚠️ Course 15150 – ISM Code Compliance Maintenance of the ship and equipment led every SMS detainable subcategory. Multiple technical deficiencies in one exam become evidence the SMS itself is not working.
🧭 Course 15106 – ISM Code – Shipboard Operations A master and chief officer unable to demonstrate familiarity with security exercises and drill record keeping. Shipboard operations was the second-largest SMS detainable subcategory.
🛟 Course 11104 – Rescue Boats Immediate availability led the lifesaving detainables: rescue boats that could not be started or deployed on demand.
⚡ Course 04114 – Emergency Generator and Emergency Power Emergency power and electrical systems were a 2025 EEP campaign topic, and electrical installations were among the drivers of the working and living conditions category’s first appearance in the detainable overview.
👀 What to Watch
The EEP tells you where the flashlight points next. The 5.44 percent deficiency rate on CO2 protective zone closures is the kind of result that shapes future exam emphasis. Ships bound for US ports should treat boundary closures, dampers, and door seals around fixed CO2 spaces as a standing self-check item, not a dry dock item.
QUALSHIP 21 gets harder from 2027. The Coast Guard expanded flag eligibility criteria in 2026 to require that Corrective Action Plans from IMO Member State Audit Scheme audits be formally accepted, alongside stricter suitability rules and the removal of conditional renewals, per Work Instruction CVC-WI-002(2). The new criteria apply to eligibility evaluations beginning in 2027. Enrollment already fell roughly eight percent in 2025; the bar is moving up, not down.
The Targeted Flag List is live math. Five flags came off the list this year, and flags with small US exam counts can move on or off it on a single detention. For operators, the flag on the stern is an exam-frequency decision, and the six high-risk registries now carry three-year ratios between 2.10 and 31.25 percent.
Cyber is entering the exam conversation. The report’s foreword frames cyber defense and resilience as inseparable from the new technologies entering the fleet, from alternative fuels to autonomous systems. Expect the compliance frameworks around vessel cyber footprints to keep tightening.
Watch the port call number. 76,351 calls in 2025 against 84,034 in 2024 is a roughly nine percent drop in US port traffic from a nearly identical vessel population. The report offers no explanation. Fewer calls with more exams means a higher probability that any given arrival gets boarded.
🚨 SwiftAction Signal
The Coast Guard just published a report showing that even in the major PSC regime with the lowest detention ratio, the ships that fail still fail on fire safety, on drills, on rescue boats, and on Safety Management Systems that exist in a binder and nowhere else. Seventy-seven crews learned that lesson at the dock in 2025. In Miami alone, thirteen.
A detention in a US port costs days off-hire, a lasting scar on the vessel’s targeting profile, and a company name in a federal database. A SwiftAction module mapped to the exact deficiency code costs $17 and produces a completion record documenting a passed assessment before the PSCO ever walks the gangway.
For ships trading to the United States, the USCG Boarding Defense System bundle packages twenty modules aligned to the deficiency categories American inspectors cite most, for $199: academy.swiftaction.ai/bundles/uscg-boarding-defense-system
Start with Course 07106. It is free.
⚓ The SwiftAction Team
SwiftAction Intelligence Is Published Daily. For partnership inquiries contact admin@swiftaction.ai
📋 Full Training Catalog: academy.swiftaction.ai 🎯 Prepare for US port calls: academy.swiftaction.ai/bundles/uscg-boarding-defense-system